
CPOMS INTEGRATION
Your CPOMS data, finally in one view.
Safeguarding and behaviour insight, at a glance.
Schools BI brings your CPOMS data into your existing dashboards. You get a clear view of safeguarding and behaviour trends across your school or trust, so leaders and DSLs can spot patterns and start the right conversations, without handling sensitive case details.

What You'll See...
Two areas of your Schools BI reporting, powered by CPOMS.
Safeguarding
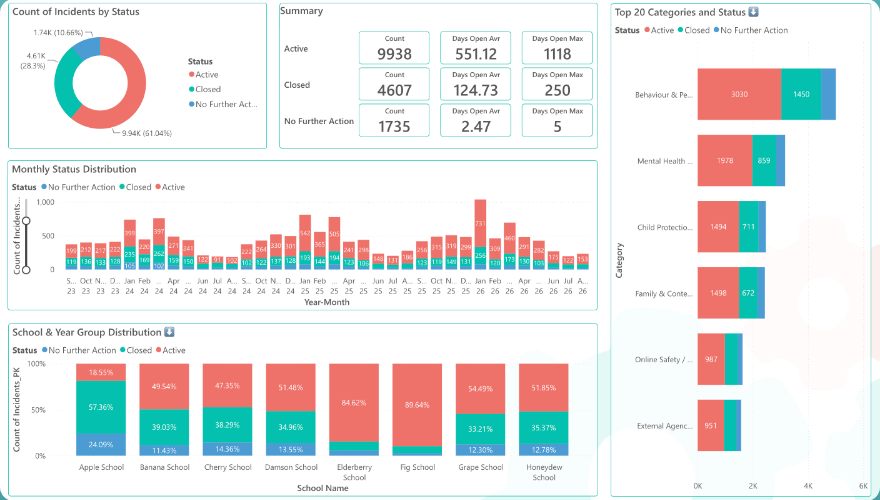
CPOMS Incidents and CPOMS Status dashboards.
Behaviour
CPOMS conduct data added to your existing Conduct dashboard.
Incidents by category, sub-category and status
Trends by year group, and by school for trusts
Year-on-year comparisons that show when incidents usually spike
How incident status is used: are incidents closed as resolved or left open?
What Could Your CPOMS Data Tell You?
Clearer insight for Governors, CEOs, Headteachers, SLT, DSLs and Behaviour Leads.
Compare every school
See your whole school at a glance, or compare every school in your trust side by side. Ideal for CEOs and trust leaders.
Spot trends early
Pick up patterns you might otherwise miss, from seasonal spikes to pressure points in particular year groups.
Better conversations
Check practice is consistent, share what works, and give leaders and DSLs a shared starting point.
A healthier CPOMS
See how your categories are really being used. Many schools discover far more categories than they realised.
Evidence your progress
Year-on-year views show where incidents are rising or falling, ready to share with governors and safeguarding committees.
Plan your budget
Use clear trends to decide where safeguarding and behaviour spending will make the biggest difference.
How It Works...
Simple to set up, and kept up to date for you.
1
Requires CPOMS Insight
CPOMS Insight is purchased directly from CPOMS.
2
Refreshed overnight, every night
Data refreshes overnight, in line with CPOMS.
See It In Action...
Book a demo or talk to our team about adding CPOMS to your Schools BI dashboards.