
School Attendance Dashboard for Schools and MATs
The Schools BI Attendance Toolkit helps schools and MATs track, analyse and improve attendance with clear, visual dashboards. Bring attendance data from your MIS into one place, spot trends earlier, and give leaders the insight they need to take action with confidence.


Before
After

Get the Full Picture of Attendance
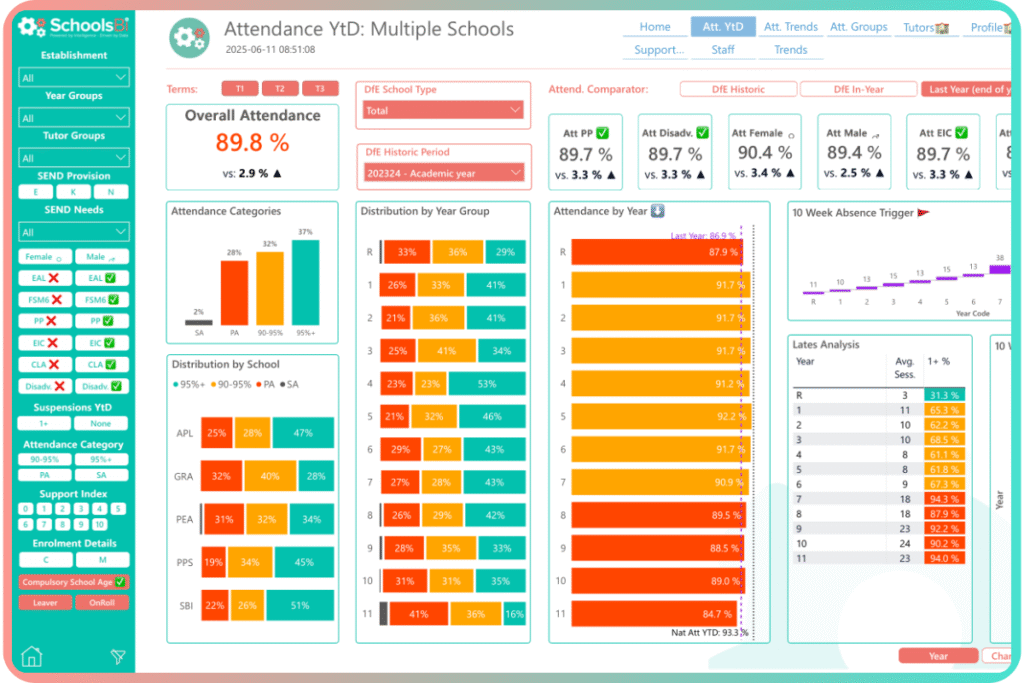
Attendance data is only useful when it is easy to understand and act on. The Attendance Toolkit brings together your school’s attendance information in one streamlined dashboard, helping you monitor patterns over time, compare groups, and identify where intervention is needed most.
With the Attendance Toolkit, you can:
- Track attendance trends across different time periods.
- Compare attendance by year group, class, tutor group and pupil characteristics.
- Move from raw data to clear actions faster.
Spot Issues Early and Take Action
With real-time insights and early warning indicators, school leaders can identify emerging attendance concerns before they become larger problems. This supports faster intervention, better reporting, and more targeted support for pupils and families.
Using the toolkit, you are able to:
- Identify persistent absence and emerging attendance risks.
- Filter by key groups to uncover patterns and priority areas.
- Support proactive attendance strategies with better visibility.
Got 45 seconds?
This short video gives a quick overview of the dashboard, highlighting its key features and how easy it is to use.

Whole Tutor Group View...
Analyse data specific to tutor groups all one place, with the Attendance Toolkit Tutor dashboard view.

Built for UK State Schools and MATs
The Attendance Toolkit is designed for UK state schools and MATs that need a clearer, more consistent view of attendance. By bringing data from popular MIS platforms into one place, Schools BI helps leaders reduce admin time and improve the quality of attendance reporting across their setting.
Schools using the toolkit benefit from:
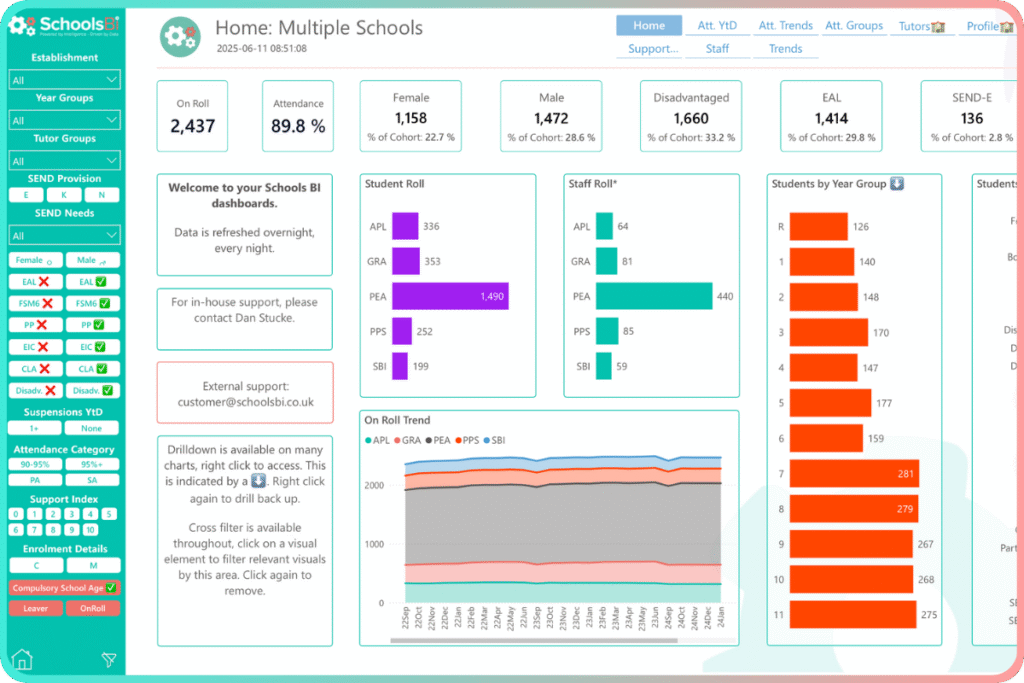
- One central view of attendance data for schools and trusts.
- Easier reporting for leaders, governors and wider stakeholders.
- Less time spent on manual spreadsheets and fragmented reports.
Attendance Data You Can Filter and Share
Use flexible filters and tailored reports to explore attendance in more detail and share the right insights with the right people. Whether you are reviewing whole-school trends or focusing on specific pupil groups, the dashboard makes attendance analysis faster and more practical.
The Attendance Toolkit enables you to:
- Filter by metrics, groups and time periods.
- Create reports that are easier to present and discuss.
- Support decision-making with clearer attendance evidence.
Why Schools Use the Attendance Toolkit
Schools need more than registers and static reports; they need dashboards that make attendance easier to monitor, explain and improve. The Attendance Toolkit helps turn attendance data into a usable decision-making tool, so staff can spend less time buried in admin and more time supporting pupils.
Schools that use the toolkit see:
- Clearer attendance insights.
- Earlier, better-informed intervention opportunities.
- Better reporting and a reduced admin burden.

Words from a very happy customer...
“This is going to save our team weeks / months of analysis time.”
“This is brilliant, magnificent. I could marry you for the Attendance Trends! That is my governor’s report.”
Martin Allison – Assistant Headteacher, North Huddersfield Trust School


The Schools BI Process...
At Schools BI, we help schools improve education, wellbeing and pupil experience through smarter use of data. As former teachers, governors and data managers, we understand the challenges, so let’s work together to solve them.
Before
Implementing
The Benefits
Is your attendance data presented in one place and easy to analyse? If yes, you’re all set. If not, here are some common challenges you might recognise.
Scenario One: You're juggling multiple contacts and data sources, and still missing deadlines.
Scenario Two: You've built your own dashboards, but progress is slow, costly and untrustworthy.
Scenario Three: Attendance data is a concern, but you have no way to effectively analyse and action your data.
Whether you rely on your MIS, other systems, or spreadsheets, we’ll help you get the most from your data.
Made the decision to enhance your data process with Schools BI? Great! Here's what you can expect.
Once you've signed up: You are welcomed by our Customer Success Manager. We then start the process of setting up your SSO, and any MIS integration.
Kickoff Meeting: This outlines your dashboard goals, and the development begins.
Ready To Go: After meetings, feedback, and reviews, the project is signed off. We ensure that integrations are all updating daily to keep your data up to date.
Read our next tab "The Benefits" to see what you'll get out of Schools BI.
Analyse your data with multiple attendance metrics, groups and trends available within a few clicks.
- Detailed filtering and analysis across all key characteristics.
- Access for all staff within a school.
- Prior and current year national and local authority data comparisons.
- Analysis pages designed for Headteachers, through middle leaders and to tutors/teachers/support staff.
How does this all sound? Amazing right, well why not see it for yourself? Let's have a chat.

Instantly Analyse Attendance Trends...
Analyse your attendance, while comparing to national, local and school trends, across different time periods.
See the Attendance Toolkit in Action
Book a demo to see how the Attendance Toolkit works with your school or MAT data. We’ll show you how the dashboards help you monitor attendance, identify trends and support better decision-making across your setting.